

Stanford Hospital faced a challenge familiar to many large healthcare systems: delays in surgical start times were cascading through the day, creating operational inefficiencies, staff fatigue, and financial loss.
Deepwake partnered with Stanford’s interventional platform leadership and a multidisciplinary team of nurses, physicians, and managers to design a data intelligence dashboard that visualized performance, improved workflows, and reduced costly delays.
Within months, the hospital saw dramatic improvements in efficiency, teamwork, and revenue, saving nearly $500K annually through better coordination and smarter design.
The Challenge
Operating rooms are the financial and clinical core of a hospital. Even small inefficiencies in scheduling or preparation can lead to lost time, underused capacity, and significant financial impact.
At Stanford, inconsistent documentation, poor visibility, and disconnected systems were creating costly delays in first-case starts and daily turnover.
Key Issues Identified
- Data scattered across multiple tools and spreadsheets
- Missing consent forms and incomplete documentation before patient arrival
- Lack of standardized workflows across teams
- No consolidated way to track OR utilization and first-case start performance
- Limited ability to compare performance over time
The leadership team needed a unified view of operations that would help teams act on data, not just report it.
The Approach
Deepwake led the UX and design strategy for the project, combining ethnographic research, workflow mapping, and close collaboration with Stanford staff.
We worked directly with nurses, anesthesiologists, surgeons, and operations managers to understand the full perioperative process from pre-op to incision start time.
Research Insights
- Documentation errors and missing consent forms were the leading causes of first-case delays.
- Nurses and pre-op staff spent excessive time searching for patient information across systems.
- Surgeons and anesthesia teams had no shared visibility into room readiness or scheduling bottlenecks.
- Executives lacked visual tools to track year-over-year performance or identify trends.
These insights shaped our design strategy: build a dashboard that simplified complexity, unified workflows, and created shared visibility for every stakeholder.
The Solution
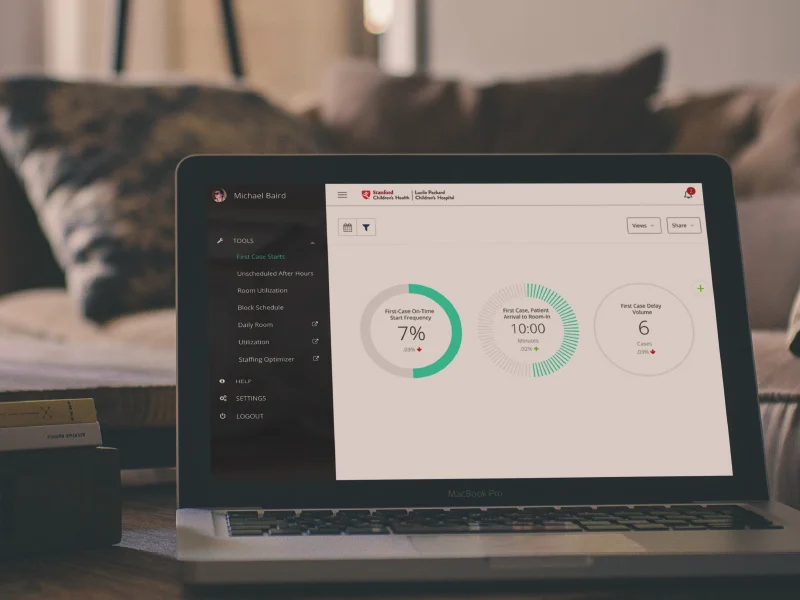
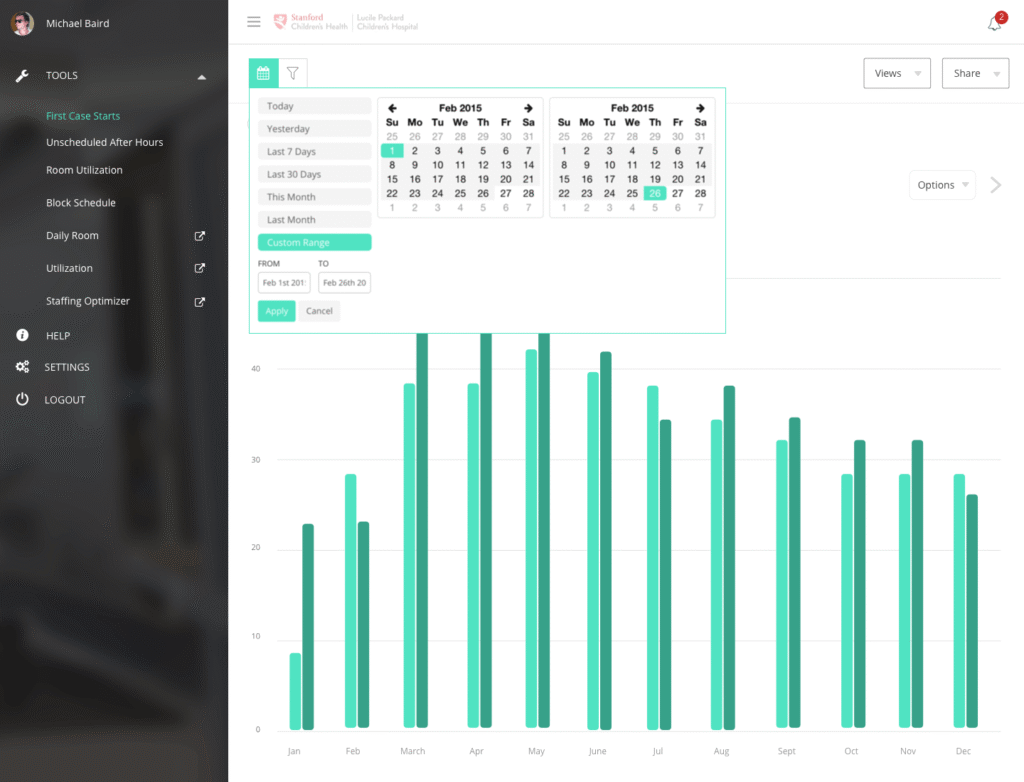
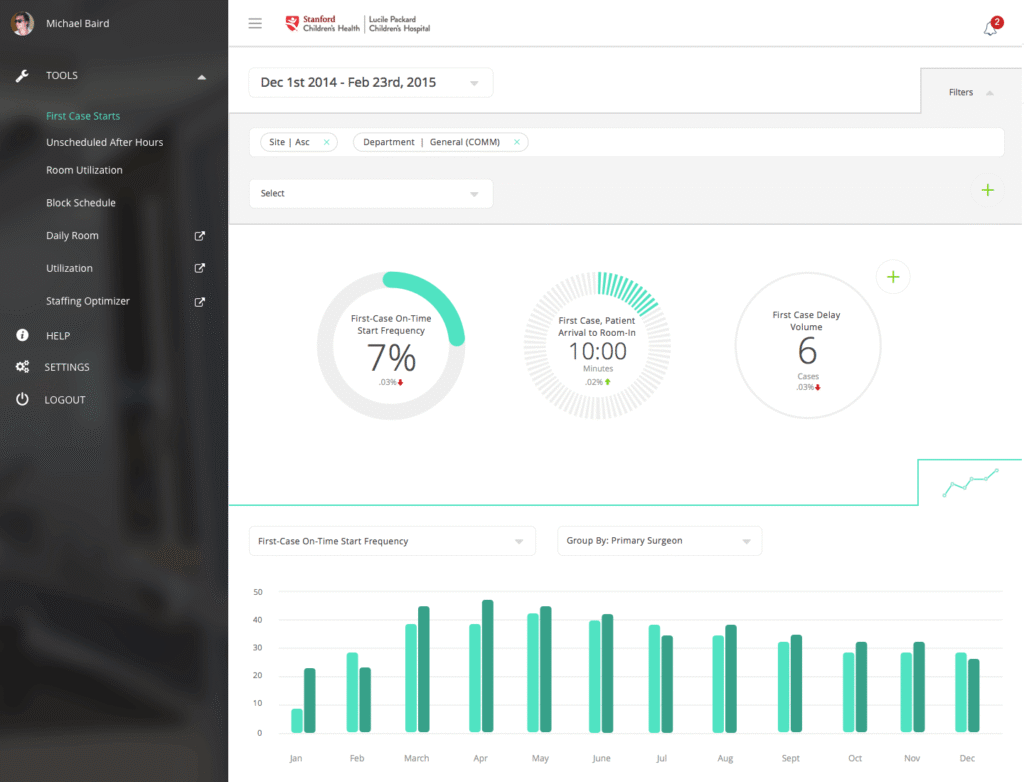
We designed the OR Optimization Dashboard, a web-based data visualization system that integrated real-time and historical data into a single, accessible interface.
Core Features
- First Case Start Tracker: Monitors on-time vs delayed cases and highlights the main causes of delays.
- Room Utilization Overview: Shows how each OR is being used throughout the day.
- Block Schedule Analyzer: Identifies unused or underused blocks for optimization.
- After-Hours Insights: Helps balance workloads and reduce overtime.
- Staffing Optimizer: Forecasts optimal staffing based on historical data.
- Comparative Analytics: Allows performance tracking over multiple time periods and departments.
The dashboard was designed for quick comprehension and adoption, using high-contrast visuals, intuitive navigation, and contextual data cards for clinical leaders and administrators.
Human-Centered Design in Action
- For Nurses: Clear, visual indicators showed when documentation was missing or incomplete.
- For Surgeons: Real-time insights into room readiness and turnover helped minimize downtime.
- For Executives: Interactive data visualizations provided a high-level view of operational and financial performance.
This shared visibility turned the dashboard into a decision-making platform rather than another reporting tool.
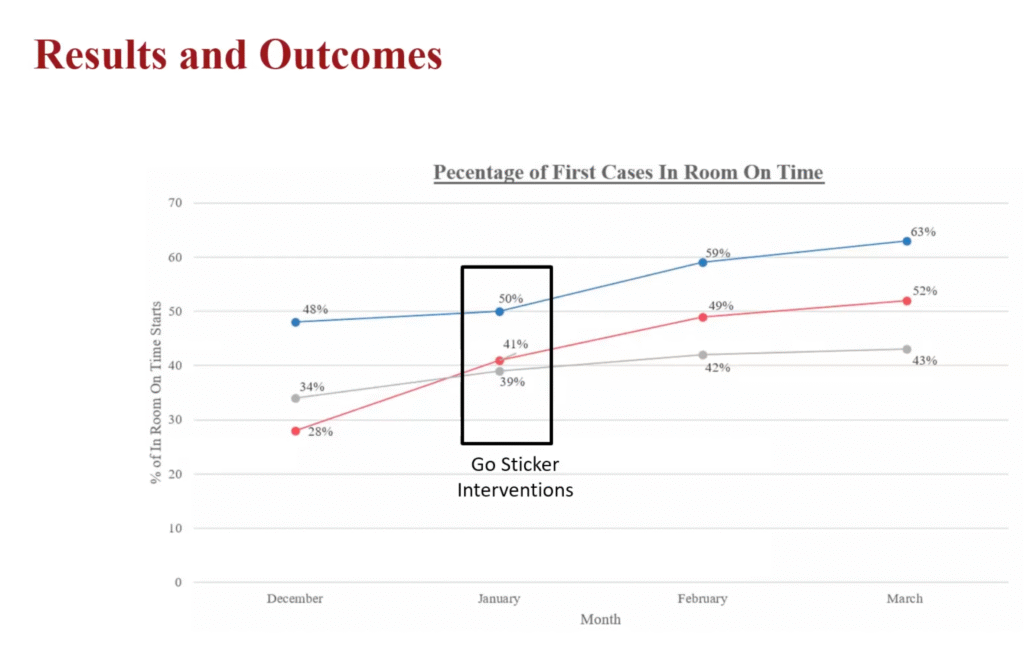
Measured Results
- Improved on-time first-case starts from 37% to 53%
- Saved approximately 55 staff hours across nearly 2,000 cases
- Reduced after-hours usage and overtime costs
- Generated nearly $500K in annual savings through increased efficiency in the first year
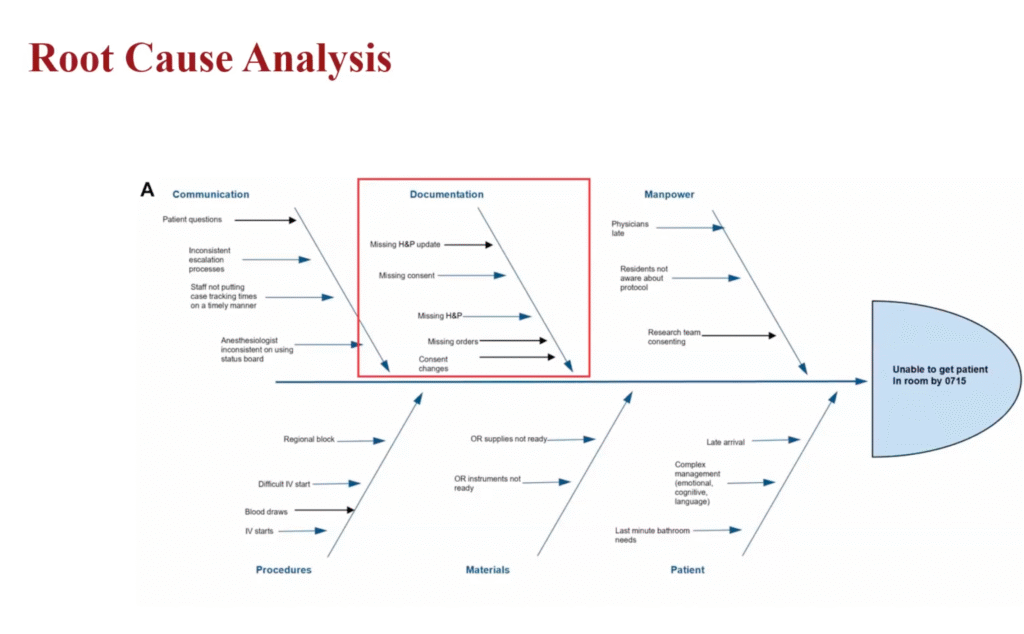
Root Cause Analysis and Workflow Redesign
The dashboard was supported by a comprehensive process review, mapping each step from scheduling to room setup.
Key Process Improvements
- Standardized antibiotic order sets and automatic triggers.
- Streamlined consent form retrieval in Epic.
- New standardized templates for H&Ps linked directly to surgical encounters.
Each change removed unnecessary manual steps and improved accountability across the OR ecosystem.
Results and Impact
The project delivered measurable improvements across clinical, operational, and financial metrics.
Quantitative Outcomes
- Improved on-time first-case starts from 37% to 53%
- Saved approximately 55 staff hours across nearly 2,000 cases
- Generated nearly $500K in annual savings through increased efficiency in the first year
- Fewer documentation-related delays and cancellations
Qualitative Outcomes
- Improved collaboration between surgery, anesthesia, and nursing teams
- Increased transparency and trust in performance data
- Stronger culture of accountability and continuous improvement
Collaboration and UX Research
The success of this project relied on deep collaboration with Stanford’s teams.
We facilitated workshops, observed OR preparation workflows, and tested prototypes with real users.
This participatory design approach ensured that every feature matched the day-to-day needs of those managing surgical operations.
Our UX Process Included:
- Contextual inquiry with OR and pre-op teams
- Journey mapping and delay analysis
- Interactive dashboard prototyping and testing
- Stakeholder validation and iterative refinement
Lessons Learned
What Worked Well
- Cross-disciplinary collaboration and open communication
- Ongoing data validation and transparent reporting
- Continuous education and feedback from staff
What Could Evolve Further
- Expanded rollout across all surgical service lines
- Real-time Epic integration for immediate updates
- Sustained behavioral training for new staff and residents
The Outcome
The OR Optimization Dashboard became a cornerstone for performance improvement at Stanford Hospital.
By connecting design, data, and human insight, the hospital created a culture of proactive problem-solving and shared accountability.
“The dashboard completely changed how we communicate about performance. For the first time, everyone could see the same truth.”
— Operations Director, Stanford Hospital
Reflection
This project demonstrates Deepwake’s core philosophy: when you combine human-centered design with intelligent systems, you create change that lasts.
Through collaboration, data visualization, and thoughtful design, we helped Stanford Hospital move from reactive management to proactive insight — improving both patient care and operational excellence.
Deepwake designs intelligence that works for people, creating systems that drive clarity, collaboration, and measurable impact.